Page 15 - CIBER-BBN2016-ENG
P. 15
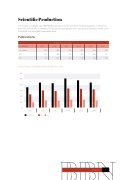
Scientific Production
The evolution undergone by CIBER-BBN publications can be seen from the following tables, in which the data from 2010 to 2016 is analysed. The publications per group for this year are also itemised, as well as the interCIBER and intraCIBER cooperation work.
Publications
EVOLUTION OF CIBER-BBN PUBLICATIONS 2011-2016
Publications per year
CIBER-BBN
2011
2012
2013
2014
2015
2016
No Totales
362
450
439
524
491
450
Q1
237
308
297
343
338
327
D1
95
130
124
142
142
125
600
500
400
300
200
100
0
2011
2012
2013
2014
2015
2016
No TOTAL
Q1 D1
BBN
organisation 15